Share this
by Ben Rowan on 08 March 2016
In this series of posts we started by troubleshooting a hard to find software performance problem and in part two began following the trail to performance problems in front of the webserver. Then in part three we narrowed in on the problem with a some confidence that Citrix was a contributing factor. A meeting was booked to show what we’d found and I was confident the problem wouldn’t appear, but it did…
There’s nothing quite like a demonstration completely contradicting what you expected to happen. The information learned in that moment was pivotal, but it would have been nice to find it under different circumstances! The characteristics of the performance problem were becoming clearer: We were now looking at an issue which appeared when Internet Explorer was being used remotely – either via Remote Desktop or from within a Citrix environment.
Profiling
Our client uses Internet Explorer 9. IE9 has a set of developer tools built in which, among other things, can profile the performance of JavaScript. We decided to see what difference remotely accessing a browser made to the performance of JavaScript, and were surprised with the results.
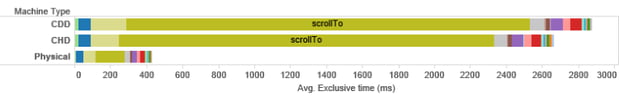
We decided on a few scenarios to profile, and set about recording several iterations from a physical PC, a CHD session and a CDD session to measure the differences. The results are quite striking: This chart shows the “Exclusive Time” for the top 20 JavaScript functions during a particular navigation event within the application. We can clearly see that the scrollTo function performs significantly worse via CDD or CHD than it does via a physical PC.
Patterns similar to this were repeated throughout the system. Very interesting, but we did manage to experience slow performance on a physical PC when the machine was accessed via Remote Desktop. Why?
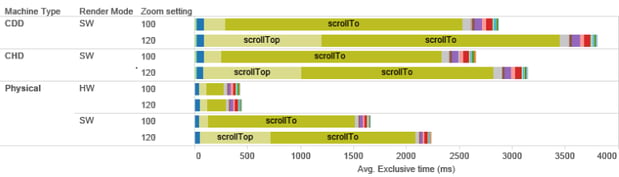
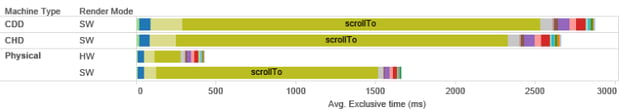
Some further reading about the way Internet Explorer behaves in remote environments pointed out that when accessed remotely, IE defaults to using software rendering. Some further profiling using both hardware and software rendering modes proves this point:
This was excellent news: From a scope of “there’s a problem, please find it” we had narrowed the issue down to inefficiencies in the execution of a specific JavaScript function when called in software rendering mode. During profiling, we also discovered that performance was much better with the IE zoom function set to 100% than it was when set to 120%:

Knowing what the problem is doesn’t automatically fix it, of course, and efforts to address this issue are presently ongoing:
- The application developer has released several patches which minimise the number of times scrollTo is called
- The possibility of installing hardware GPU capability in the Citrix environment is being looked at
- Our profiling suggested several things users could do to improve their performance, like always using their browser on 100% zoom where possible
- Further profiling on Internet Explorer 11 suggests better performance is likely following a browser upgrade, though some of the gains may be clawed back by other inefficiencies. Expect another blog post on this in future!
What did we learn?
This engagement taught us some important lessons about our testing methodology: By applying load at the HTTP level, the standard suite of tests did identify the performance changes in the application, and did confirm that the application remained stable and responsive under load. These conclusions were accurate, as the production system behaved in much the same way as the test system. And yet, users still experienced poor performance. How could we do better next time?
The HTTP injection approach cannot identify performance problems in client-side code. In an attempt to mitigate this risk, manual testers perform transactions while the system is under load from the test rig, and report on their experience. In most cases that is sufficient, but in this case didn’t provide the information we needed. There are two key reasons for this:
- Manual testers accessed the system via physical PCs, and the problems only become apparent when the browser is using software rendering mode.
- Manual testers are asked for a subjective experience report, rather than being able to carefully measure statistics about the user experience.
To close these gaps:
- Have manual testers perform their transactions from a user-like platform (Citrix in this case)
- Use the developer tools in Internet Explorer to precisely measure the performance of client-side JavaScript.
These two measures now form part of our ongoing testing process, and we should catch any issues similar to this one in the future.
Thanks for reading along. I hope you’ve enjoyed the journey.