Share this
How assembly-line thinking is hurting your DevOps teams
by Carl Weller on 11 April 2019
This is the fourth post in a series exploring Lean thinking and DevOps.
In my previous post Increasing the speed of your DevOps teams I covered multi-tasking and large amounts of work in progress as two significant issues impacting the speed of work flowing through teams to customers. In this post we are going to cover another key reason work takes longer than it should; time lost due to work sitting in non-productive states.
Most knowledge-working companies still have many attributes of early 20th Century production-line thinking, particularly hyper-specialisation and a focus on utilisation. To use a factory analogy, we have many very special machines that are very good at what they do and what we care most about is how well utilised they are.
This utilisation focus comes from a cost-accounting perspective. If I spend a lot on a machine (or a highly skilled specialist), then the more they are loaded with work the less each individual work item costs. This is also known as 'economies of scale' and is the basis for the massive improvement in production and living standards in the 19th and 20th Centuries.
We've structured our IT teams around similar thinking. A good SDLC has a very standardised set of processes, done in a certain order, and with agreed outputs (even Agile teams follow this with their Definition of Done). Because we tend to focus on utilisation and following process, we forget a key difference in IT work, which is often project-based (i.e. one-off, not mass-production at all).
It is not possible to sufficiently remove sources of variation from knowledge work. And we use very specialist resources. These two factors create interruptions in the flow of work and lead to a lot of 'queuing'.
To keep being 'efficient' while dealing with variation the common tactic is to assign people more work. If they are waiting for something from upstream that hasn't arrived they may be able to progress one of their other tasks. Viewed through a utilisation lense this makes sense, right? I am keeping my 'machine' highly utilised, thus keeping unit costs low.
The greatest sin is 'to not be working on something', even if that would be better overall for the whole work system (as that 'headroom' allows a team to absorb variation, just as your PC works better when it has spare processor or memory capacity).
In Lean we call this local optimisation – a focus on the efficiency of one element rather than the efficiency of the whole system.
Here's what it probably looks like for a single task. We have a series of value-adding steps that reflect a typical SDLC.

However, because of variation in work item size and the availability of skilled resource, there is often waiting time between these steps that is non-value-adding.

There isn't as much data available online as I would like, but what I have found puts the typical ratio of non-value-adding to value-adding steps at about three to one. That is, the time lost in forms of waste (waiting, knowledge loss at handovers, fixing defects, etc.) is about 75% of the total time taken for any given work item. Some international conference speakers have reported a 'flow efficiency' of one or two percent (flow efficiency is the percentage of value-adding time when looking at the total time a work item takes).
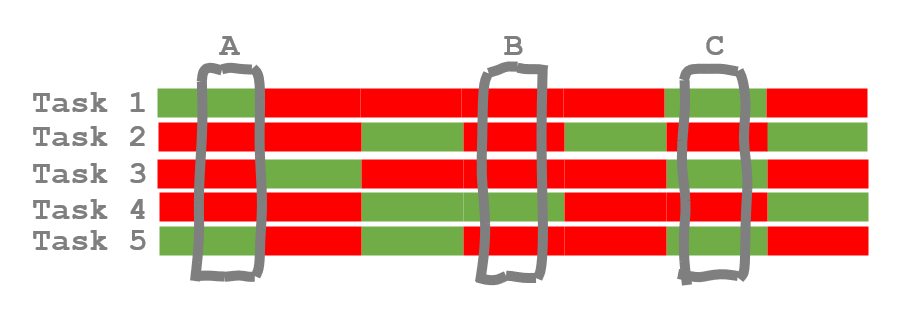
If we assume a 25% flow efficiency, then our production process looks like this (with value-adding and non-value-adding steps shown in the green and red bar below the process steps):

So how do we think we are being so efficient? Well, because whenever we look at a person they are doing something. When you look at point A, B or C on the diagram below, people are 'busy'. Sometimes they may have more things on the go than at other times, but they are always working.

We are looking at a point in time snapshot focused solely on utilisation, not effectiveness.
Effectiveness is getting something completed as quickly as possible after it has started. Why? Because it doesn't deliver value until it is complete and, as we know from my third post in this series Increasing the speed of your DevOps teams, the more things you have on the go at once the longer they all take!
Looked at another way, if my non-value-adding time is 75% of my total time, then I am much better off trying to cut the time my work is sitting in waste states (usually just waiting for a specialist to become available to perform the next process step) than I am trying to speed up the value-adding parts of the exercise.

If I spend on average three days not adding value and one day adding value, then doubling the speed of my value-adding part (what most people see as 'doing the work') shaves off half a day. And its really, really hard to get twice as fast at something you are already reasonably good at. Let's call that an unlikely scenario.

If I cut half the time something is sitting in a queue, it means the work item is delivered in 2.5 days instead of 4. So, a 37.5% reduction in delivery time by just reducing the amount of time no-one is working on something!

So how do I make this work?
You need to see the flow of work. Its that simple. You need to see when work starts, how it progresses through different process states, where it sits waiting. In fact, all the things you would see if we were talking about physical manufacture rather than knowledge work.
In a small factory you would see a pile of half constructed work items. You would see the worker clear their bench, put the new work item on it, get the right tools for that job, do what they can, put it on the floor next to the other unfinished work items, put the tools away, grab the next work item…
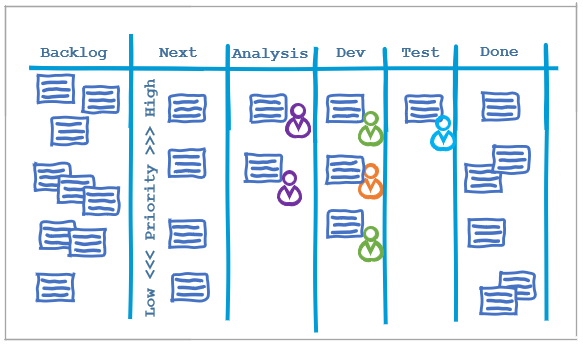
The best way to see what is happening in a knowledge-work setting is using a visual work board that represents the process states you have. The board below contains the minimum information most teams need to see flow (or lack of flow).

We are not managing work in progress through limits or using queues to smooth flow, but we can see work progress through different process states. We can count how much work is in each state and see how much work each individual has in progress. We can see when a state gets overloaded with work.
All of these things should drive team behaviour. For example:
- When a state is overloaded upstream states should slow down and use some capacity to assist to clear the growing blockage
- When all states are reasonably full no more new work should be started
- When a state has free time, but can't pull more work from an upstream state, then it could focus on process improvement…
This post has gotten longer than I expected, and we're not done yet! Stay tuned for more.
Carl Weller is a Principal Consultant specialising in Project Management and Agile Leadership, based in our Wellington office.
Share this
- Agile Development (89)
- Software Development (68)
- Scrum (41)
- Agile (32)
- Business Analysis (28)
- Application Lifecycle Management (27)
- Capability Development (23)
- Requirements (21)
- Lean Software Development (20)
- Solution Architecture (19)
- DevOps (17)
- Digital Disruption (17)
- Project Management (17)
- Coaching (16)
- IT Professional (15)
- IT Project (15)
- Knowledge Sharing (13)
- Equinox IT News (12)
- Agile Transformation (11)
- IT Consulting (11)
- Digital Transformation (10)
- Strategic Planning (10)
- IT Governance (9)
- International Leaders (9)
- People (9)
- Change Management (8)
- Cloud (8)
- MIT Sloan CISR (7)
- Working from Home (6)
- Azure DevOps (5)
- Innovation (5)
- Kanban (5)
- Business Architecture (4)
- Continuous Integration (4)
- Enterprise Analysis (4)
- Client Briefing Events (3)
- GitHub (3)
- IT Services (3)
- AI (2)
- Business Rules (2)
- Communities of Practice (2)
- Data Visualisation (2)
- Java Development (2)
- Lean Startup (2)
- Scaling (2)
- Security (2)
- System Performance (2)
- ✨ (2)
- Automation (1)
- FinOps (1)
- Microsoft Azure (1)
- Satir Change Model (1)
- Testing (1)
- March 2025 (1)
- December 2024 (1)
- August 2024 (1)
- February 2024 (3)
- January 2024 (1)
- September 2023 (2)
- July 2023 (3)
- August 2022 (4)
- July 2021 (1)
- March 2021 (1)
- February 2021 (1)
- November 2020 (2)
- July 2020 (1)
- June 2020 (2)
- May 2020 (3)
- March 2020 (3)
- August 2019 (1)
- July 2019 (2)
- June 2019 (1)
- April 2019 (3)
- March 2019 (2)
- December 2018 (1)
- October 2018 (1)
- August 2018 (1)
- July 2018 (1)
- April 2018 (2)
- February 2018 (1)
- January 2018 (1)
- September 2017 (1)
- July 2017 (1)
- February 2017 (1)
- January 2017 (1)
- October 2016 (2)
- September 2016 (1)
- August 2016 (4)
- July 2016 (3)
- June 2016 (3)
- May 2016 (4)
- April 2016 (5)
- March 2016 (1)
- February 2016 (1)
- January 2016 (3)
- December 2015 (5)
- November 2015 (11)
- October 2015 (3)
- September 2015 (2)
- August 2015 (2)
- July 2015 (7)
- June 2015 (7)
- April 2015 (1)
- March 2015 (2)
- February 2015 (2)
- December 2014 (3)
- September 2014 (2)
- July 2014 (1)
- June 2014 (2)
- May 2014 (8)
- April 2014 (1)
- March 2014 (2)
- February 2014 (2)
- November 2013 (1)
- October 2013 (2)
- September 2013 (2)
- August 2013 (2)
- May 2013 (1)
- April 2013 (3)
- March 2013 (2)
- February 2013 (1)
- January 2013 (1)
- November 2012 (1)
- October 2012 (1)
- September 2012 (1)
- July 2012 (2)
- June 2012 (1)
- May 2012 (1)
- November 2011 (2)
- August 2011 (2)
- July 2011 (3)
- June 2011 (4)
- April 2011 (2)
- February 2011 (1)
- January 2011 (2)
- December 2010 (1)
- November 2010 (1)
- October 2010 (1)
- February 2010 (1)
- July 2009 (1)
- October 2008 (1)